Metrics
Unlock complete visibility into your system's health with real-time metrics, proactive alerts, and actionable insights, empowering your team to stay ahead of performance issues and drive optimal efficiency.
Metrics Tracking Challenges
Without comprehensive metrics monitoring, teams face these critical visibility challenges:
Inability to Track Business-Specific KPIs
Standard monitoring tools focus on technical metrics but lack support for custom business metrics like conversion rates, revenue per user, or feature adoption.
"As a product manager, I can see CPU and memory metrics but have no way to track our core business KPI of daily active users alongside application performance."
Metrics Scattered Across Multiple Tools
Business metrics live in analytics tools, technical metrics in APM, and infrastructure metrics in separate monitoring systems, making correlation impossible.
"As a data analyst, I have to export data from 4 different tools and manually correlate them in spreadsheets to understand how performance impacts business outcomes."
High Cardinality Metrics Causing Cost Explosions
Tracking metrics with many unique dimensions (user IDs, transaction IDs) leads to massive storage costs and query performance issues in traditional systems.
"As a platform engineer, our monthly monitoring bill increased 10x after adding user-level metrics because our monitoring vendor charges per unique time series."
Delayed Metric Visibility
Batch processing and aggregation delays mean teams don't see metric changes for minutes or hours, preventing real-time decision making during incidents.
"As an incident responder, by the time I see the payment failure rate spike in our metrics dashboard, the issue has been ongoing for 15 minutes affecting thousands of transactions."
Limited Historical Metric Retention
Monitoring tools delete historical metrics after 30-90 days, making it impossible to analyze long-term trends or year-over-year comparisons.
"As a capacity planner, I can't analyze seasonal traffic patterns from last year because our monitoring tool only retains 30 days of metric history."
Difficult Metric Naming and Organization
Inconsistent metric naming conventions across teams make it nearly impossible to find the right metrics or understand what they represent.
"As a data engineer, we have 500 custom metrics with cryptic names like 'metric_xyz_123' and nobody knows what they measure or which team owns them."
Built for Developers,
Loved by Teams
Experience enterprise-grade metrics monitoring without the enterprise complexity. Get started in minutes and scale effortlessly.
Complete Ecosystem Coverage
Monitor infrastructure, applications, and user experience from a unified platform. Capture live insights and detect anomalies automatically.
Unified Metrics Platform
Access all key metrics in one place. Customize dashboards, eliminate data silos, and integrate with your favorite tools seamlessly.
Advanced Analytics Engine
Transform metrics into actionable insights. Track custom KPIs, spot anomalies proactively, and perform root cause analysis with ease.
How Atatus Metrics Provides Complete Observability
Track any metric that matters with measurable improvements in system visibility
Custom Business Metrics
Track any metric that matters to your business - conversions, revenue, user engagement, feature adoption. Send custom metrics from your application code and visualize them alongside technical metrics.
Unified Metrics Platform
Single platform for all metrics - application performance, infrastructure health, business KPIs, and custom metrics. Correlate any metric with any other for complete visibility.
High-Cardinality Support
Track metrics with unlimited dimensions and labels without cost explosions. Efficient storage and querying for metrics with millions of unique combinations.
Real-Time Metric Streaming
See metric changes within seconds of occurrence. Real-time aggregation and visualization enable immediate response to issues and anomalies.
Long-Term Metric Retention
Store metrics for years, not days. Analyze long-term trends, seasonal patterns, and year-over-year growth without data loss or sampling.
Advanced Metric Analytics
Perform aggregations, percentiles, rate calculations, and statistical analysis on metrics. Build complex queries to derive insights from raw metric data.
See Every Metric That Defines System Performance
Understand application, infrastructure, and container behavior in real time with contextual metrics. Track performance, resource usage, and system health across your stack using actual runtime data.
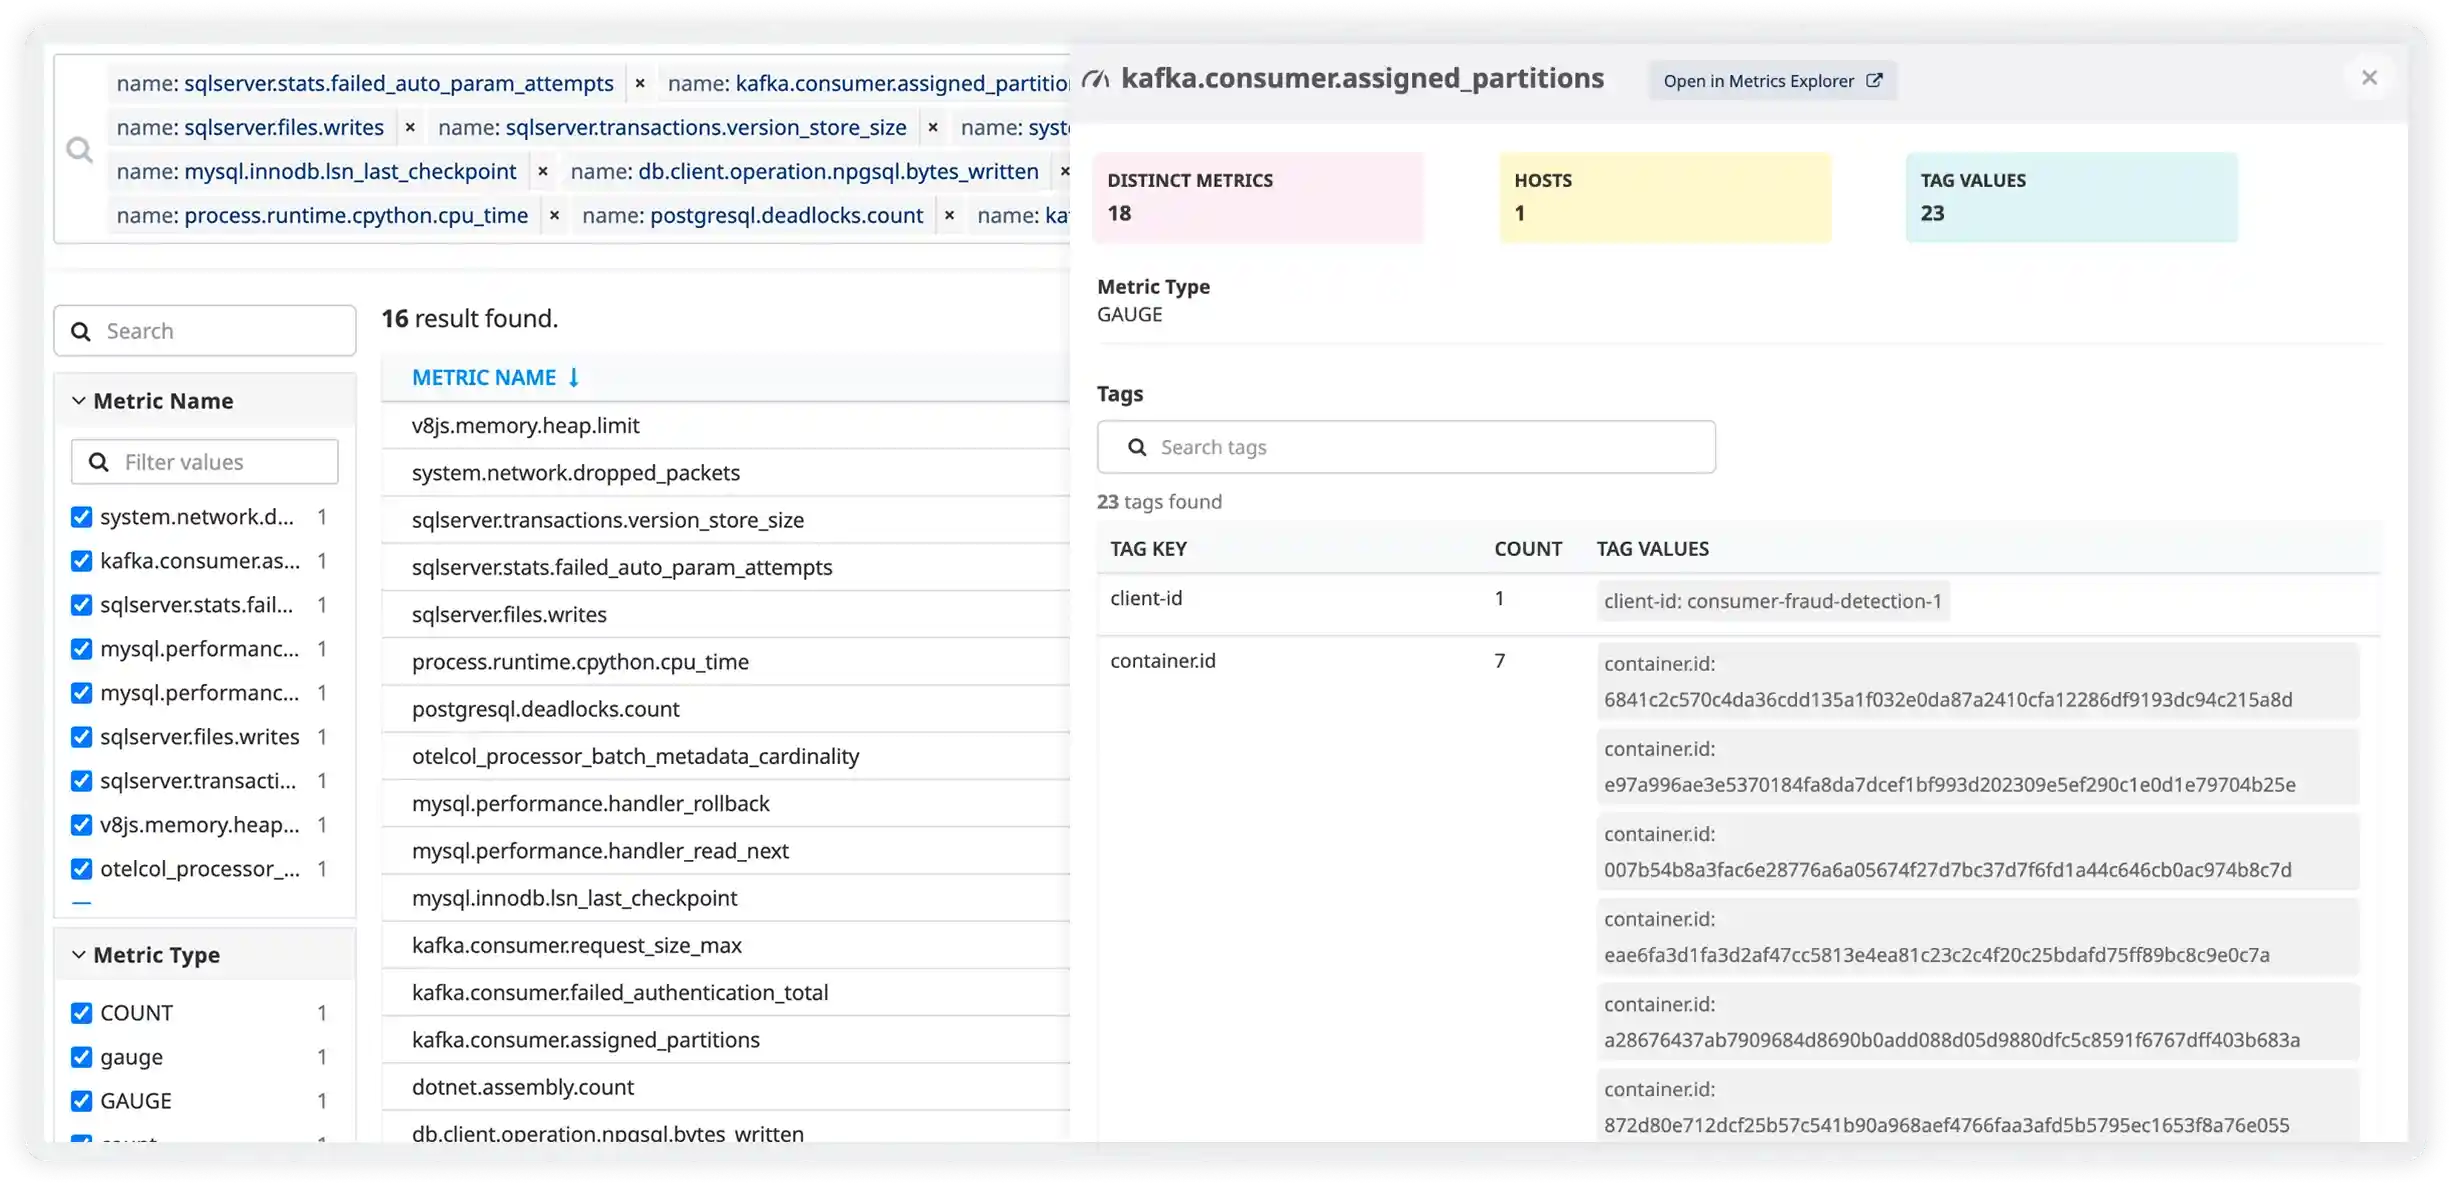
Explore Metrics Across Apps, Infrastructure, and Containers
View application, system, and runtime metrics in one place. Track GAUGE and COUNT metrics across hosts, processes, and containerized workloads without using multiple tools.
Slice Metrics Using Tags and Dimensions
Filter and group metrics using tags like container ID, host, OS, and process to compare performance across services, environments, and workloads.
Turn Raw Metrics Into Actionable Views
Visualize trends with flexible charts and aggregations. Save views, compare metrics over time, and monitor key signals with OTel-compatible ingestion.
Start Tracking Metrics in Under 5 Minutes
Three simple steps to complete metrics observability. No credit card required.
Integrate Your Stack
Connect infrastructure, applications, and services to Atatus. Start capturing metrics automatically from all layers of your ecosystem.
Define Custom Metrics
Track KPIs that matter to your business. Create custom dashboards, set up anomaly detection, and configure baseline thresholds.
Analyze and Optimize
Use real-time analytics to identify trends and bottlenecks. Perform root cause analysis and make data-driven optimization decisions.