grafana articles
9 posts from the Atatus blog.
- Dynatrace
Dynatrace vs Grafana - A Detailed Comparison for 2026
We have compared Dynatrace and Grafana by sending data from a sample application to both platforms and comparing our experience. Check out Dynatrace vs Grafana across key aspects like APM, log management, infrastructure monitoring, and more.
- Grafana alternatives
10 Best Grafana Alternatives in 2026
Grafana powerful but complex? Compare 10 alternatives such as Atatus, Datadog, Kibana & more across APM, RUM, logs & pricing. Find the right fit for your team and start monitoring in 30 minutes.
- grafana
Grafana vs Splunk - An Overview
Explore Grafana vs Splunk in this blog. Uncover a game-changer - Atatus, offering comprehensive solutions. Elevate decision-making with this comparison.
- grafana
Datadog vs Grafana: Comparison Guide
Learn when to choose Datadog or Grafana for your monitoring needs. Compare features and find the best fit.
- kibana
Top 10 Kibana Alternatives
Discover the top 10 Kibana alternatives for data visualization. Learn how to select the best tool to meet your organization’s specific needs.
- Observability
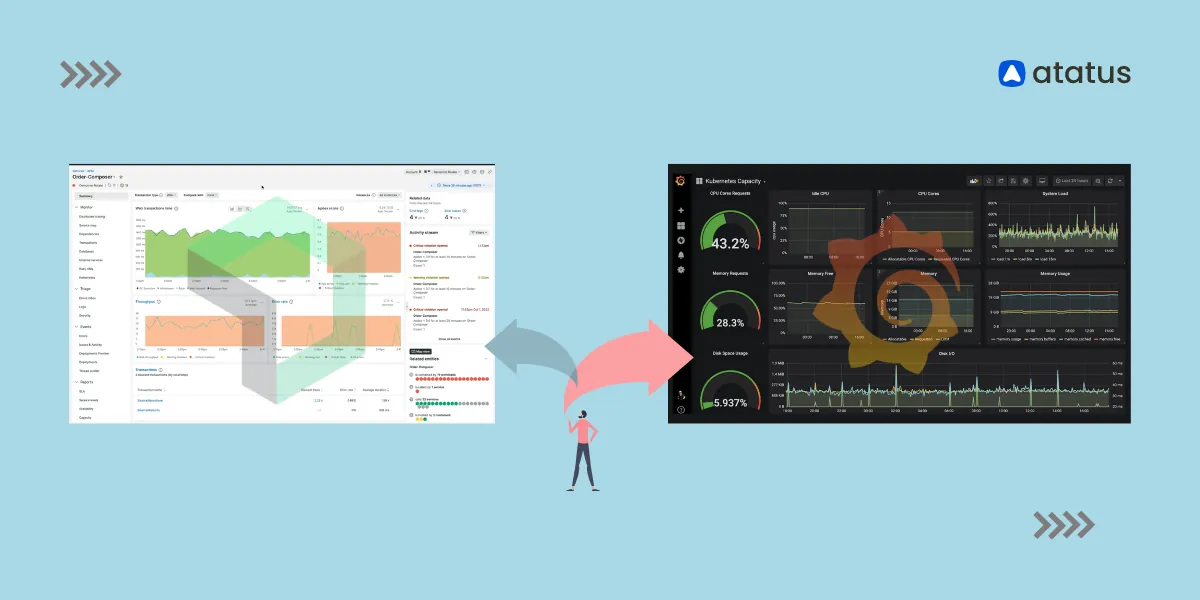
New Relic vs Grafana - Comparison
New Relic and Grafana were compared using evaluation of their features. Explore their performance in APM, log management, application security, and more.
- splunk
Splunk vs Prometheus: A Side-by-Side Comparison
I have compared Splunk and Prometheus across log management, metrics monitoring, pricing, and more. See their differences to understand their strengths.
- Prometheus
Prometheus vs Grafana - A Comparative Guide to Key Differences
I have compared Prometheus vs Grafana, two top observability tools. Check out their key differences to understand their strengths.
- dashboard
Kibana vs Grafana: Battle Of the Dashboards
Keeping tabs on your system activity is gaining traction more than ever in the present age. But something even more eye-catchy are the dashboards. Let's discuss Kibana and Grafana here!