- JavaScript
11 Best Tools to Monitor and Debug JavaScript in 2026
In this article, we have listed tools to monitor and debug JavaScript for a better user experience. Error detection and correction are made simple by the JavaScript monitoring tools.
- Java
Top 7 Java Performance Metrics to Monitor
Java's functionality and programming flexibility increased concurrently with technological advancement. A top 7 list of performance metrics to measure when evaluating the health of Java applications.
- APM
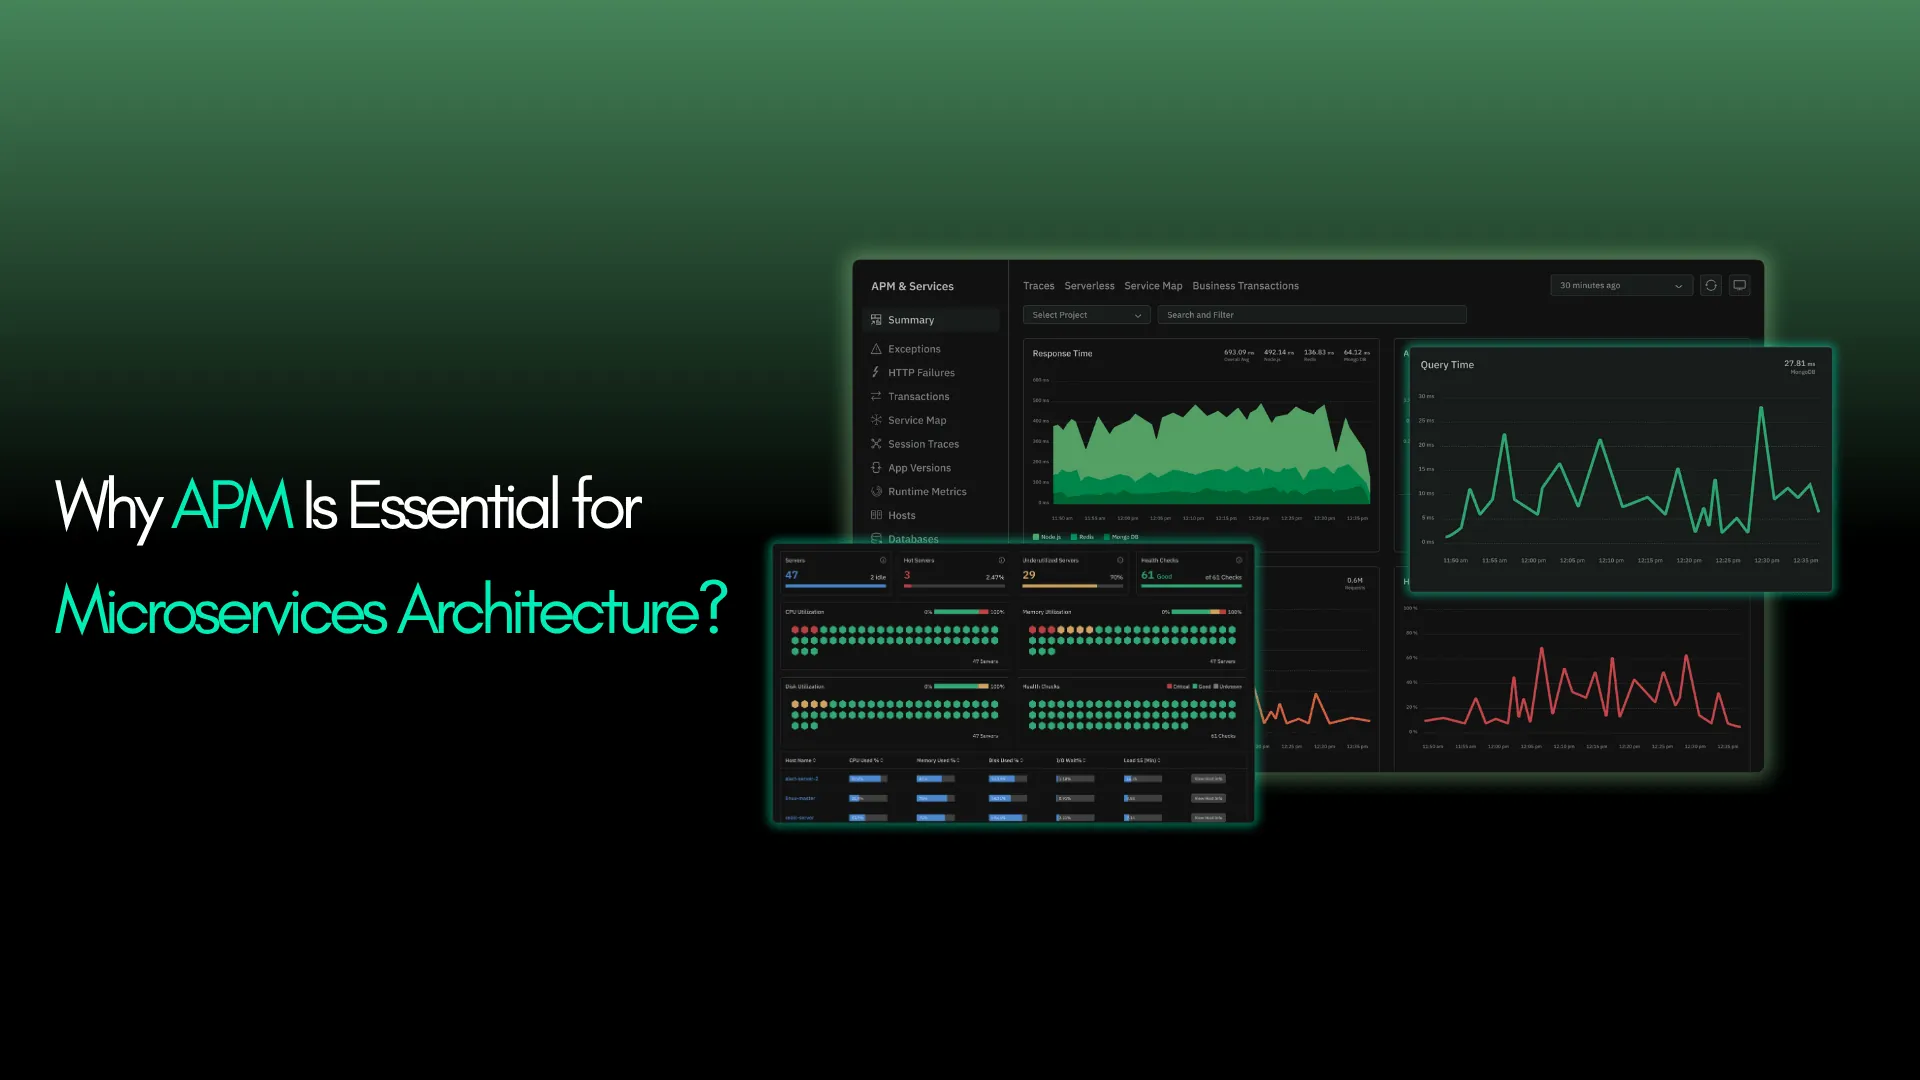
Why APM Is Essential for Microservices Architecture?
APM is critical for microservices architecture as it helps detect bottlenecks, trace service interactions, and resolve issues faster ensuring seamless performance across distributed systems.
- Competitor
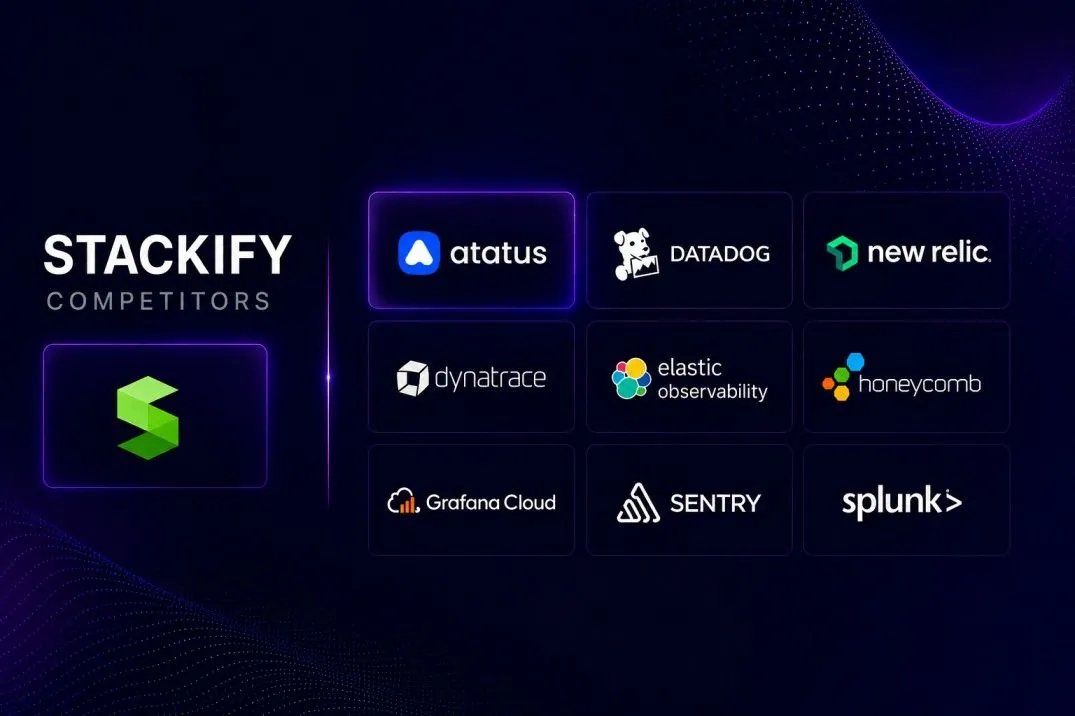
Stackify Retrace Alternatives in 2026
Stackify Retrace reaches End of Life on March 31, 2027. Here are the best alternatives for APM, logs, and tracing, including Atatus, built for full-stack, OpenTelemetry-ready observability.
- Node.Js
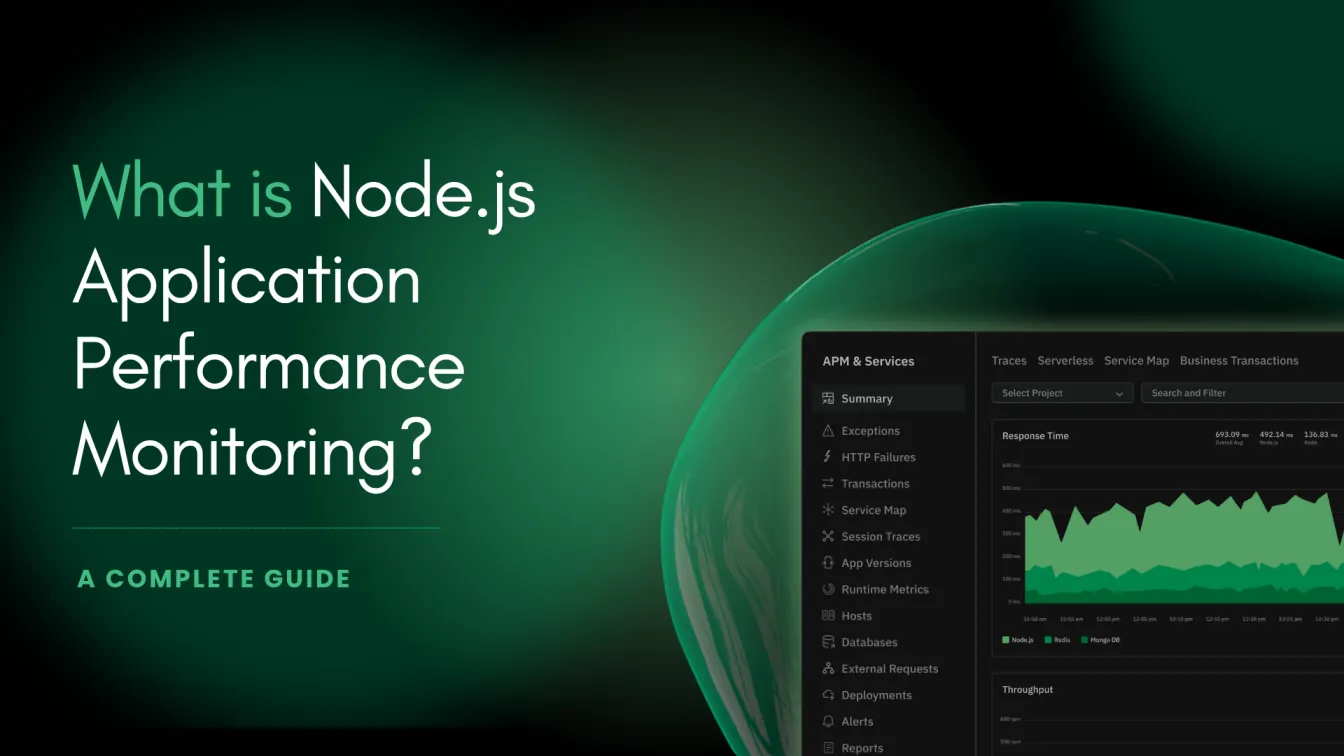
What is Node.js Performance Monitoring? [A Complete Guide]
Struggling with slow Node.js apps? Learn how to monitor performance, track vital metrics, fix bottlenecks, follow best practices, explore top tools, and see why Atatus is a smart choice.
- APM
Application Performance Monitoring (APM) Use Cases Every DevOps Team Should Know
Explore 10 essential APM use cases DevOps teams use to detect issues, optimize performance, and ensure smooth, reliable deployments.
- APM
The Complete Guide to APM Best Practices for Developers, DevOps & SREs
A list of Application Performance Monitoring (APM) best practices to help you improve your application's speed, reliability, and overall performance.
- PHP
PHP Monitoring Best Practices for Developers, DevOps, and SREs
Explore why PHP monitoring matters in 2025, with real-world practices, common pitfalls, and examples for developers, DevOps, and SREs. Includes a detailed guide and tooling insights.
- PHP
PHP Profiling: Find Slow Code in Your Application
Profiling tools keep track of essential details like how long statements and functions take to run, how many times they're called, and so on. The output can be examined to determine where bottlenecks exist.