- Prometheus
Prometheus Architecture Scalability: Challenges and Tools for Enhanced Solutions
Prometheus is an open-source monitoring and alerting toolset made for keeping tabs on the functionality, status, and metrics of software applications and systems.
- Monitoring
Top 10 LogicMonitor Alternatives
Need to monitor your Infrastructure? Keep track of your CPUs, Servers, and more with these Top 10 LogicMonitor Alternatives.
- Java
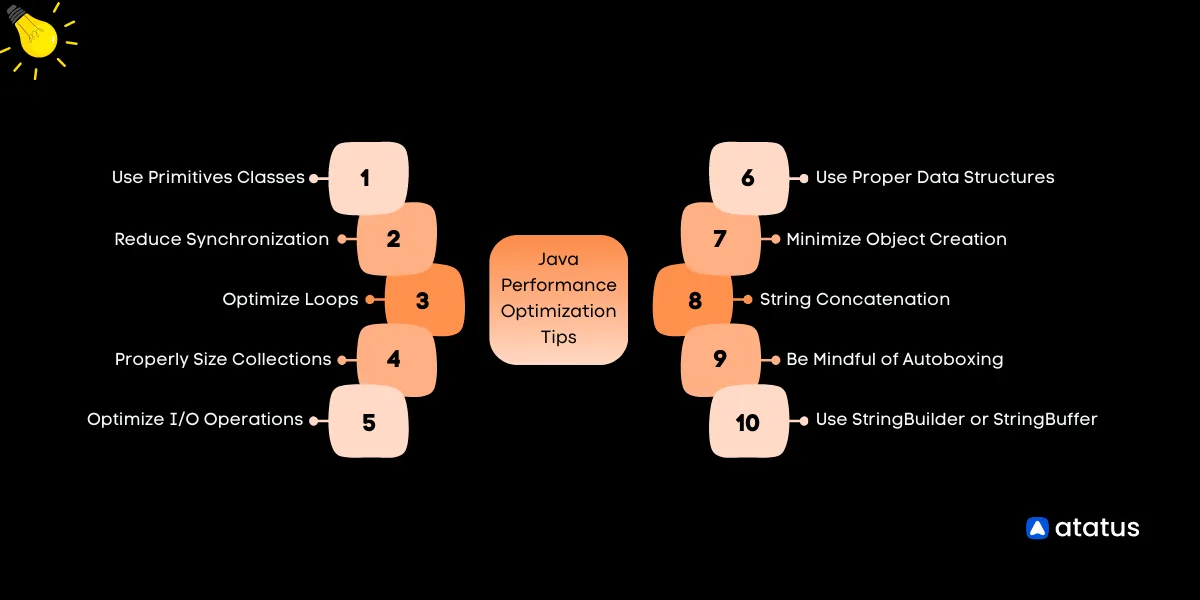
Java Performance Optimization Tips
Boost Java app speed with expert tips: data structures, object reuse, string handling, loop efficiency, threading, I/O, and more for optimal performance.
- mysql
Top 10 MySQL Monitoring Tools
Need to keep an eye on your MySQL Database? This blog details the top 10 MySQL Monitoring tools available now. Read through and find the one that fits you best!
- SIEM Tools
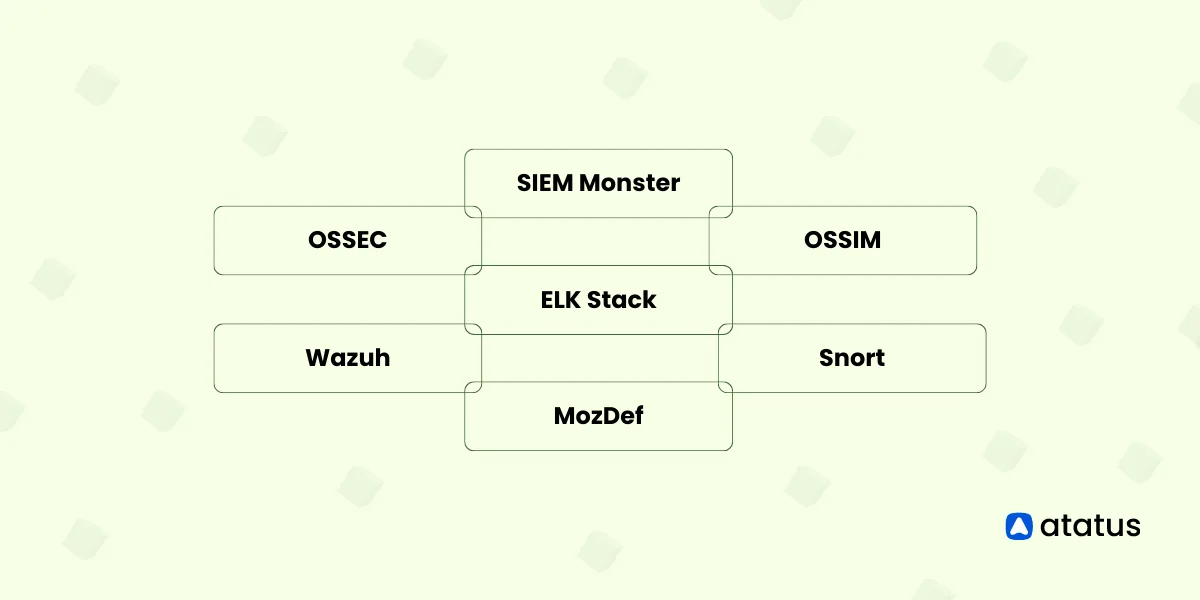
Top Open Source SIEM Tools
Explore top open-source SIEM tools for effective security information and event management, with real-time threat detection and customizable dashboards.
- MTTR
MTTR vs. MTBF vs. MTTF: Understanding Failure Metrics
Key failure metrics: MTTR, MTBF, and MTTF. Use error rate to assess and manage software failures efficiently and effectively.
- MTTR
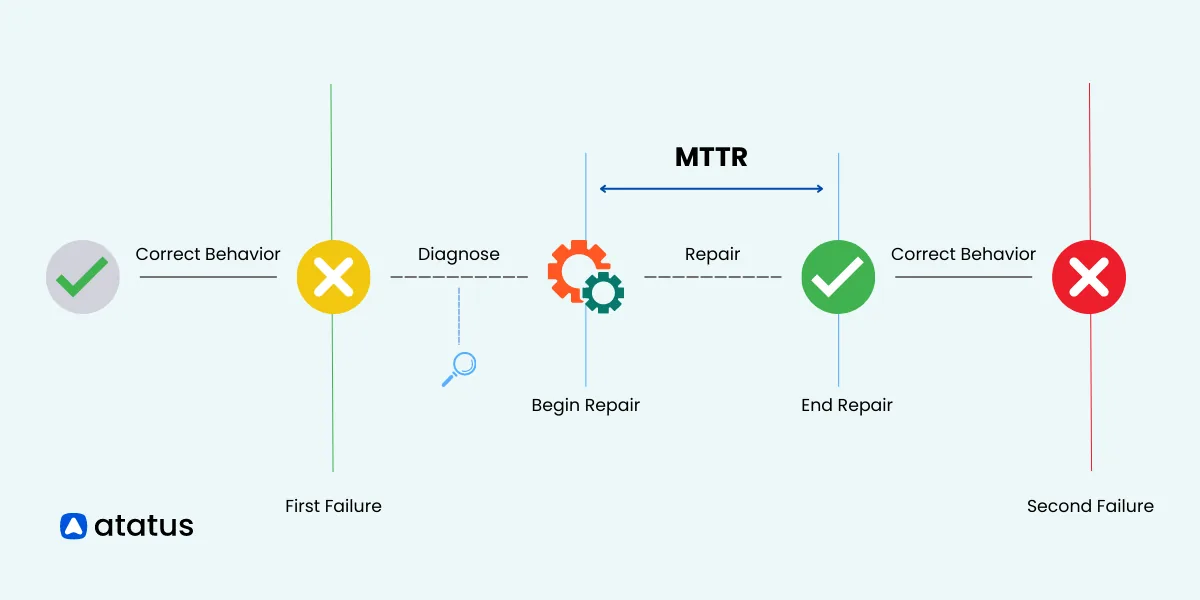
What is MTTR? Calculation and Reduction Strategies
Accelerate your incident response and minimize downtime with this comprehensive beginner's guide to MTTR for faster recovery.
- Apdex score
What is Apdex Score? Why is it Important?
Learn how Apdex scores can help you measure user satisfaction and evaluate your application and service response time.
- Span
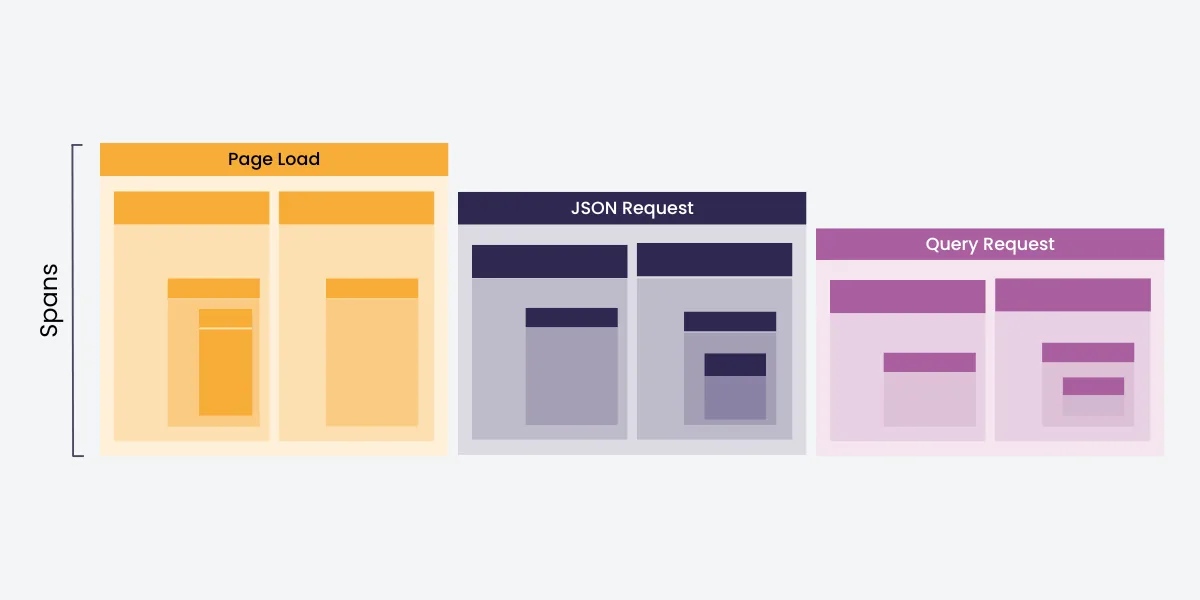
What are Spans in Distributed Tracing?
Gain a deeper understanding of spans in distributed tracing and their vital role in optimizing performance, detecting errors, and managing dependencies.