- RUM
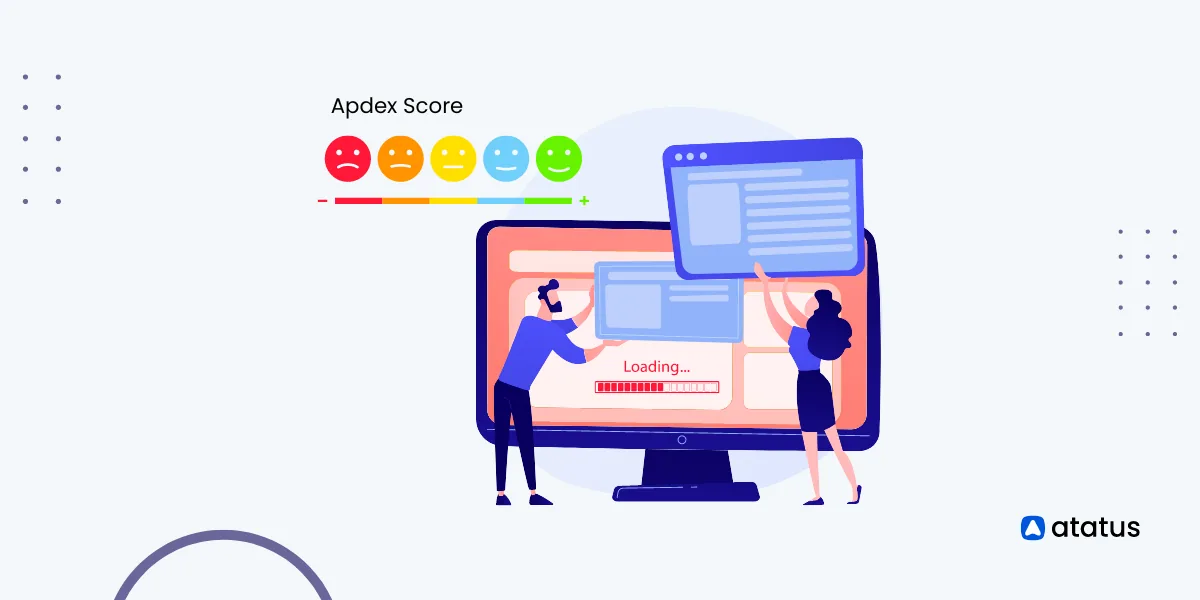
Real User Monitoring - Beginners Guide
Optimize your website/app with Real User Monitoring (RUM). Gain insights from user interactions to improve performance and enhance user experience.
- DNS Monitoring tools
Top DNS Monitoring Tools Compared: Features and Cons
we'll explore the benefits of DNS monitoring tools, key features to look for when choosing a tool, and top DNS monitoring tools available in the market.
- Java
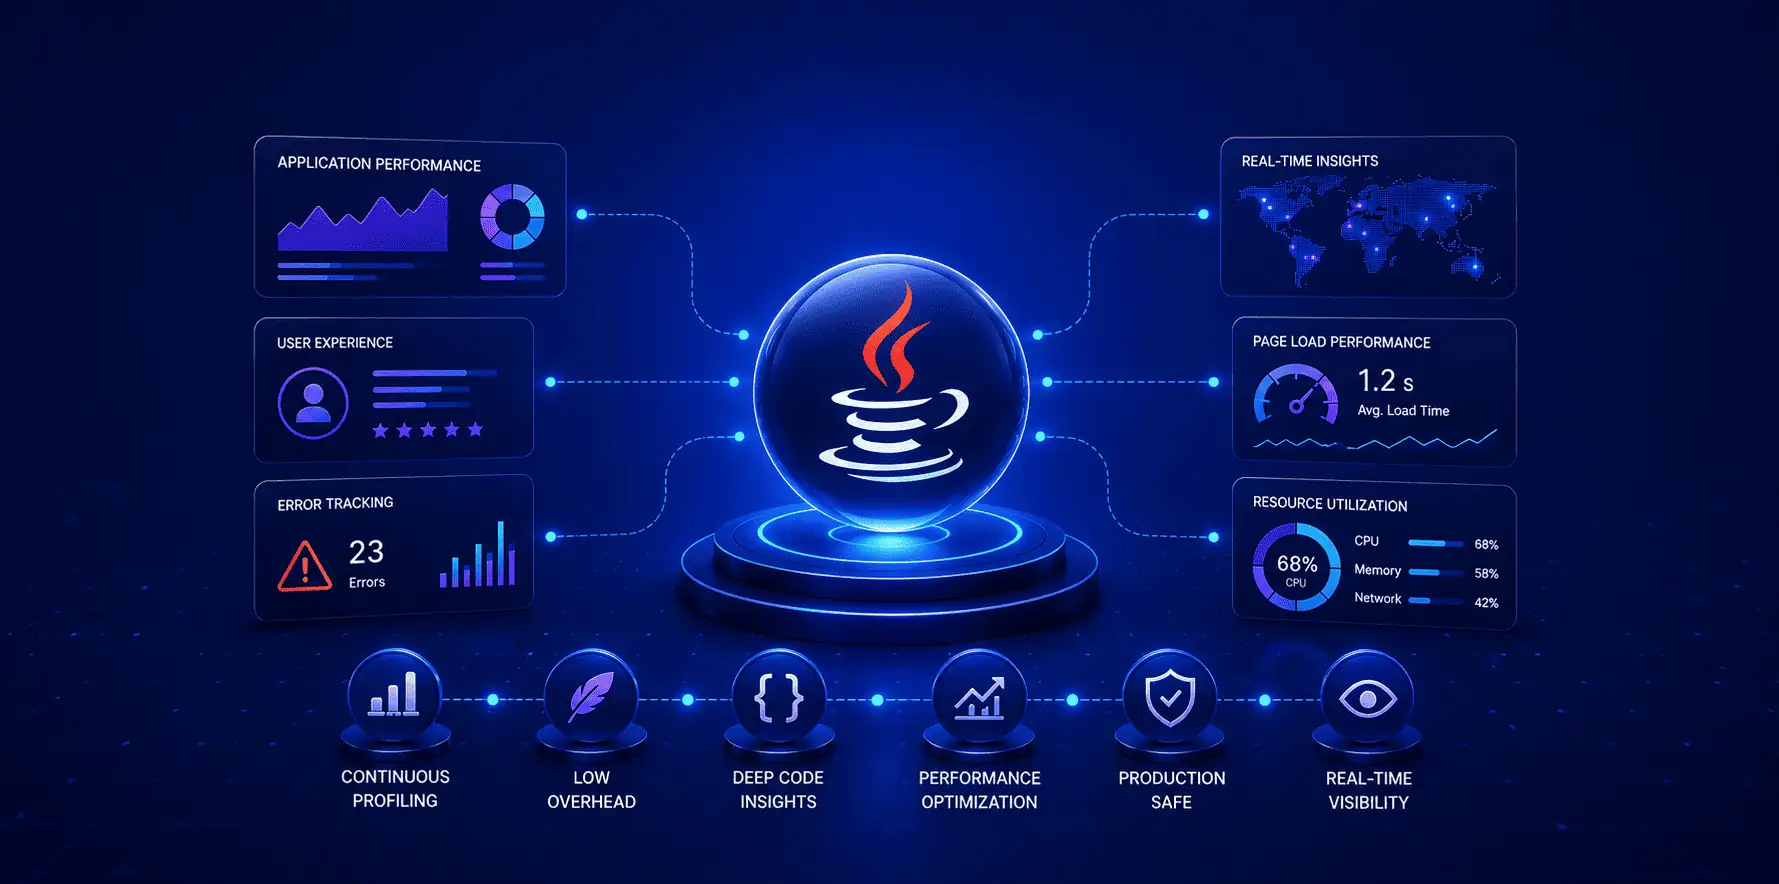
Profiling Java Applications with Java Agents: A Practical Guide
Java agents let you profile CPU, memory, and method execution without touching your source code. Here's how to build one from scratch, and when to reach for a full profiler instead.
- grafana dashboard
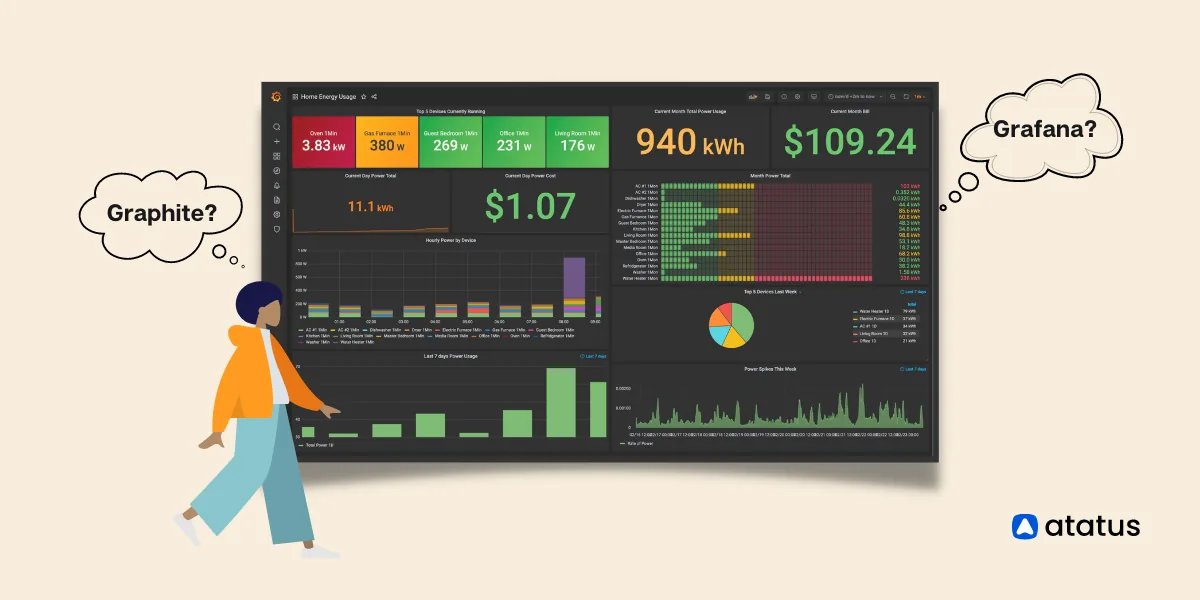
Grafana vs Graphite: A Comparison for Data Visualization and Analysis
Uncover insights about your business performance with Grafana and Graphite. This blog is set to give you the right beginning!
- Prometheus
A Comprehensive Comparison of Prometheus and Nagios
Are you considering Prometheus or Nagios for your monitoring solution? This detailed comparison will help you make an informed decision.
- TTI
From Loading to Interaction: A Guide to Time to Interactive Improvement
Dive into the exciting world of Time to Interactive - the key metric for website performance. Let's make the web faster and more interactive together!
- Database monitoring
Database Monitoring: Ensuring Optimal Performance and Reliability
Database monitoring ensures stable & reliable systems. Learn how it works, the data sources it uses, & its benefits. Improve performance & availability.
- opentelemetry
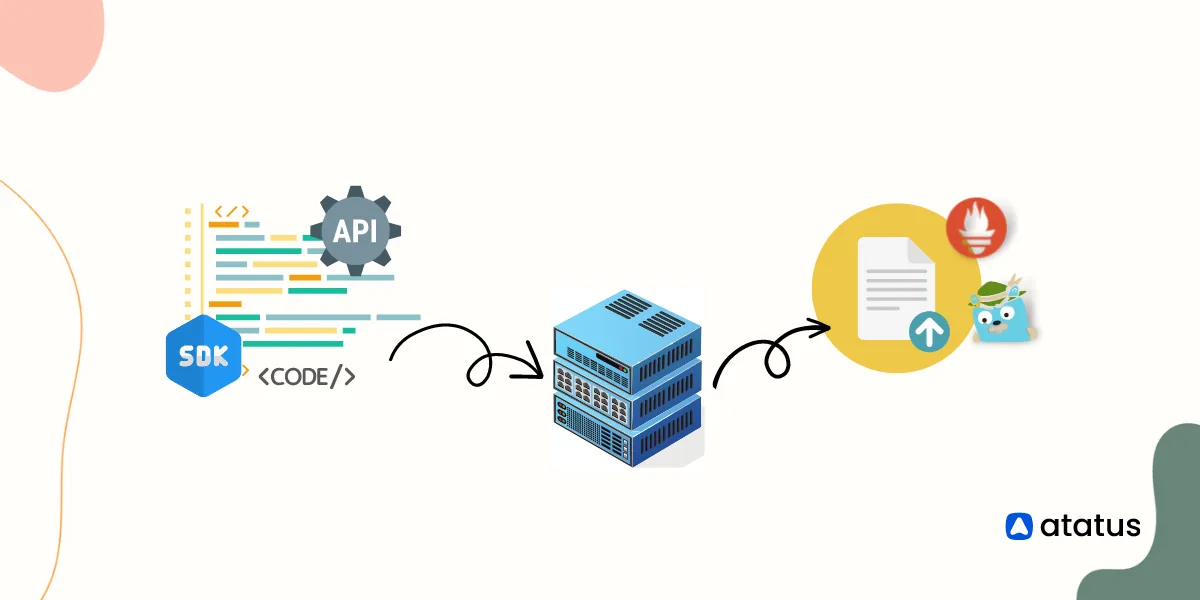
A Beginner's Guide to OpenTelemetry
With OpenTelemetry, you can collect and process standard data from disparate sources to gain insights into your system performance. Check out our guide to learn more!
- kubernetes logging
Kubernetes Logging
Learn how to use the kubectl logs command to set up and debug a Kubernetes cluster for production-grade log monitoring and analytics.